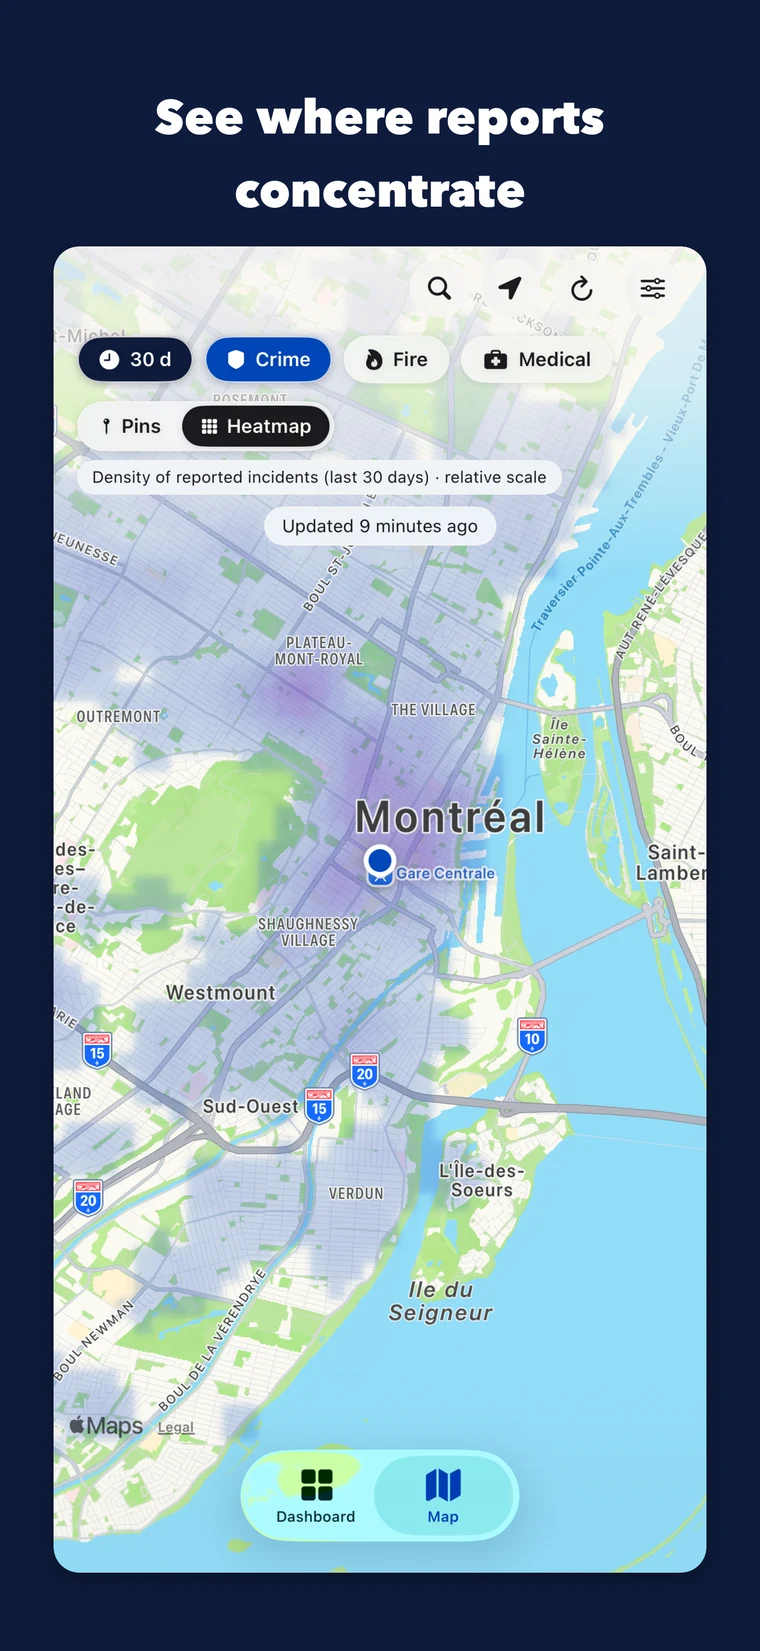
Density heatmap
See relative concentrations across your selected time window.
 INCIDENTMTL
Montréal, at a glance
See what the Montréal police (SPVM) have reported near home, work, and the places that matter — on one clean map of the island.
Free to start · No account required · French and English
01Clear map
02Saved places
03Simple filters
04Cross streets
The essentials, clearly
IncidentMTL brings City of Montréal open data into a calm, readable experience designed for everyday use.
See it in motion
A portrait loop made for the site moves through saved places, filters, cross streets, and the density heatmap — using only real app screens.
Your places
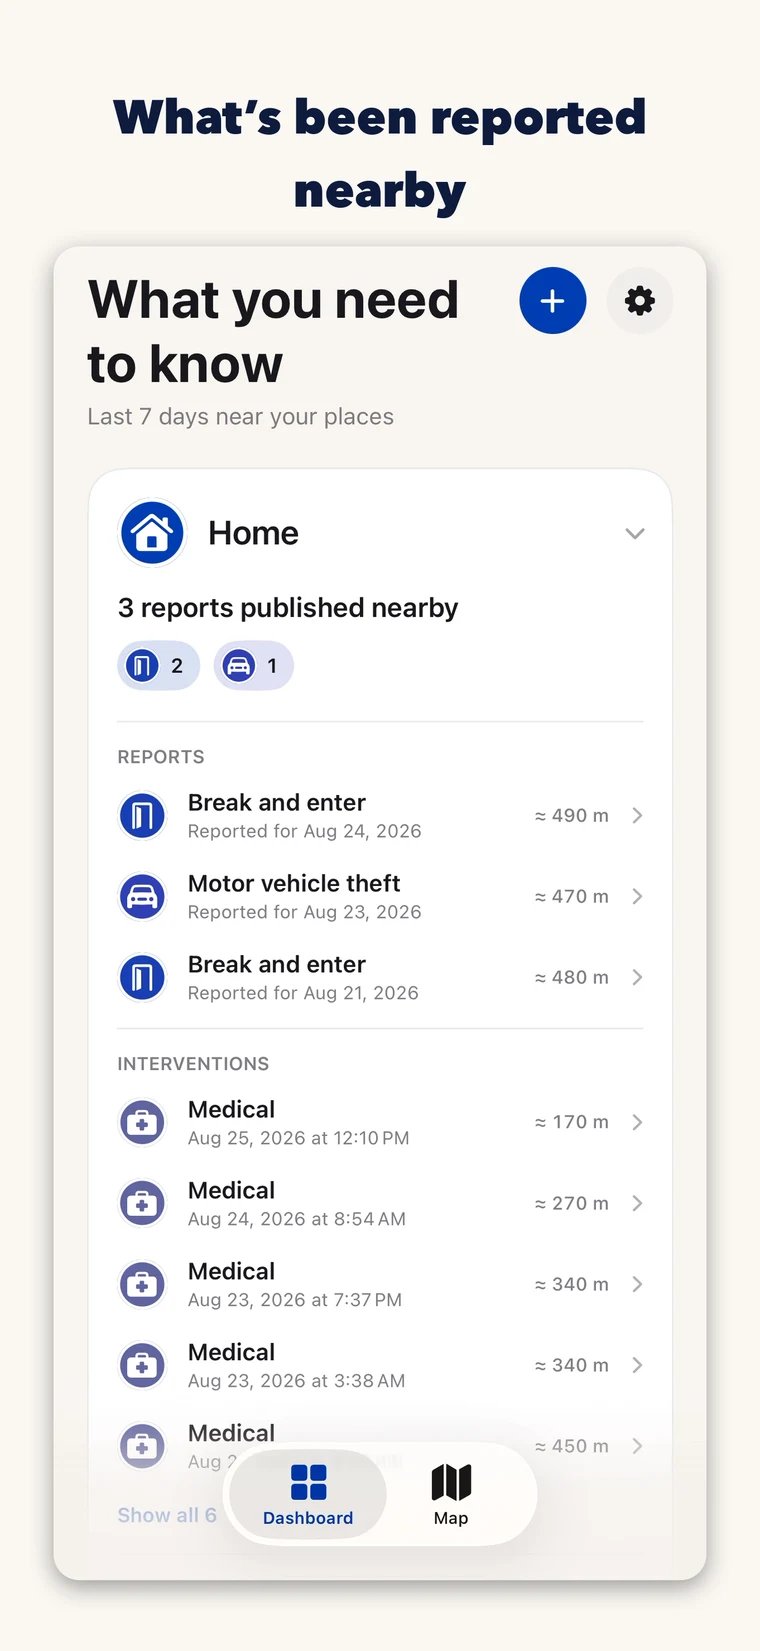
Keep the places that matter together and see what was published within 500 m, without repeating the same search.
The map
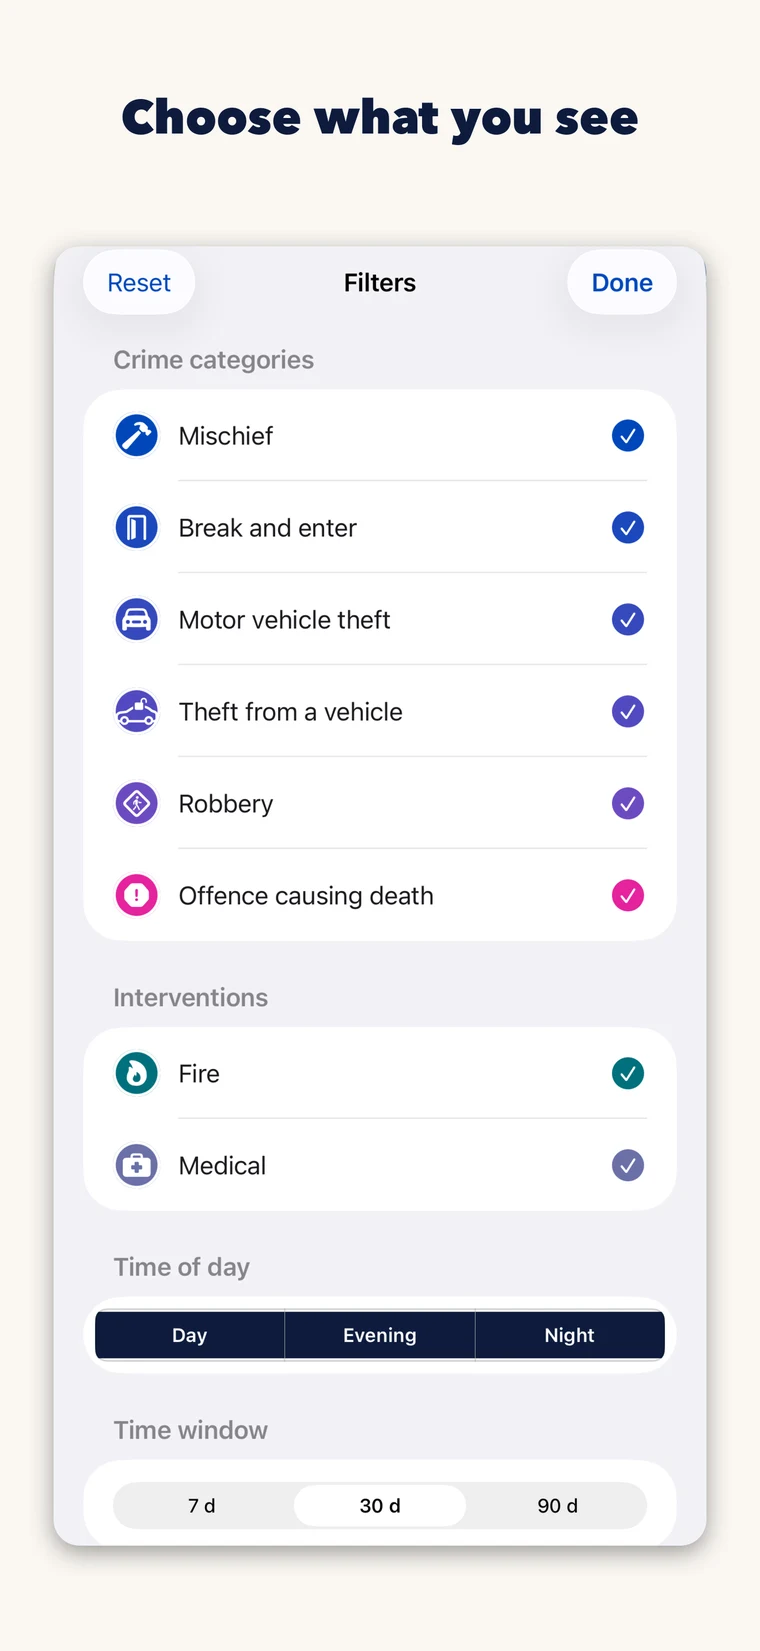
Move between crime, fire, and medical response layers, then refine by category, time window, and police shift.
The context
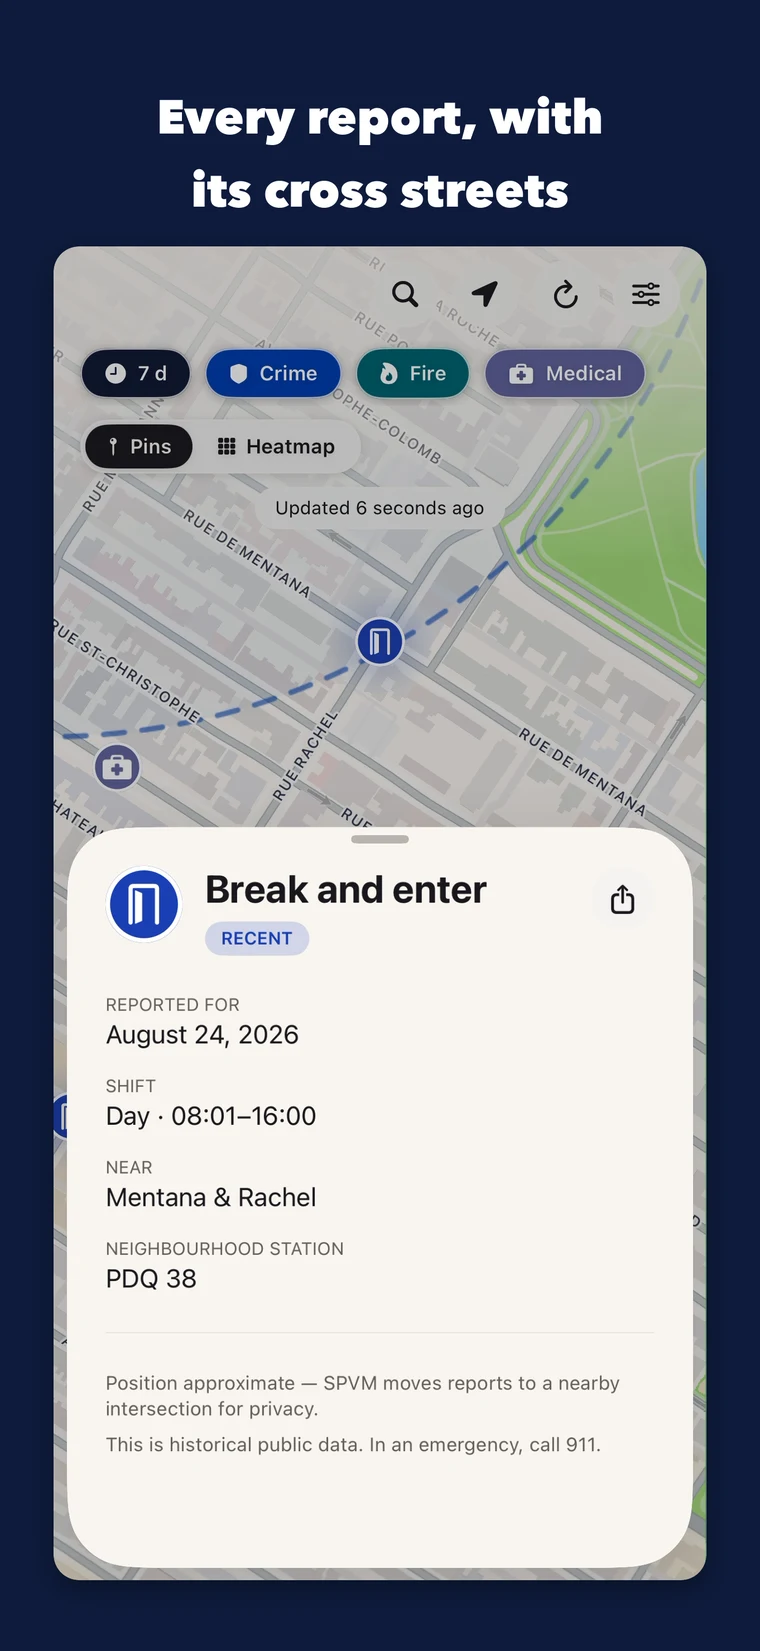
Open a clean card with the category, date, police shift, and nearest cross streets.
IncidentMTL Plus
For people who want to follow more places and see broader patterns, Plus adds focused tools while keeping the experience calm and factual.
See relative concentrations across your selected time window.
Keep several important addresses in your dashboard.
Receive a daily notice for the areas you draw.
See press coverage that may be related to a report.
Review recent changes and the seasonal outlook.
Subscription with a one-week free trial. Prices are shown in the app before purchase.
New · Neighbourhood report
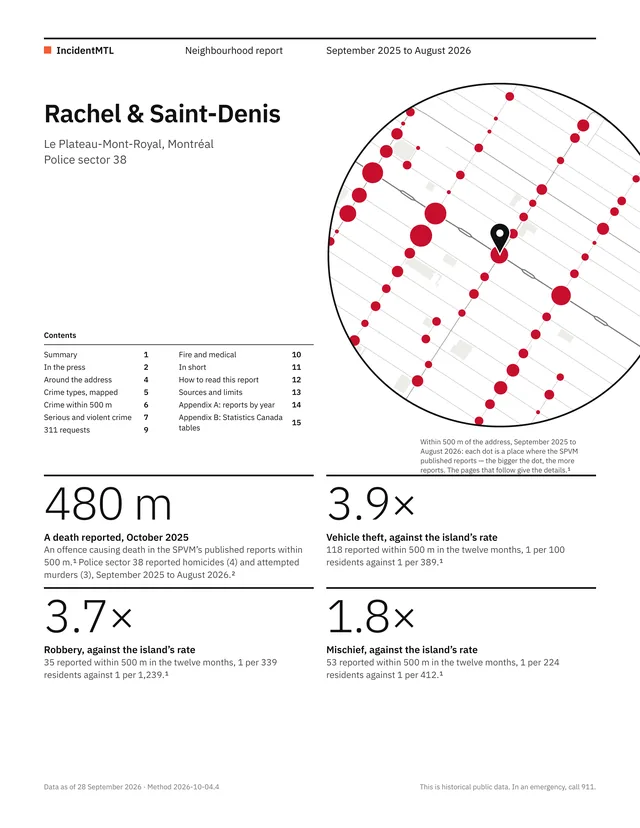
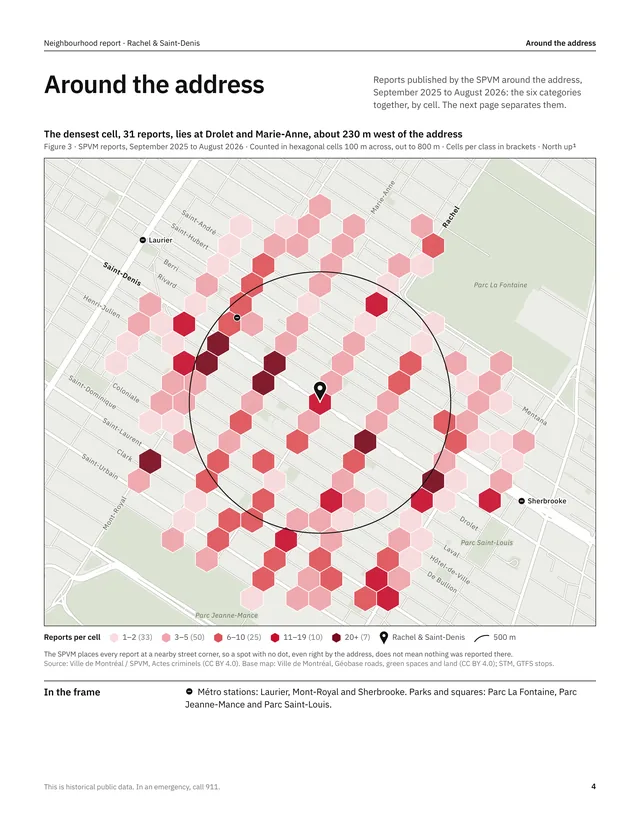
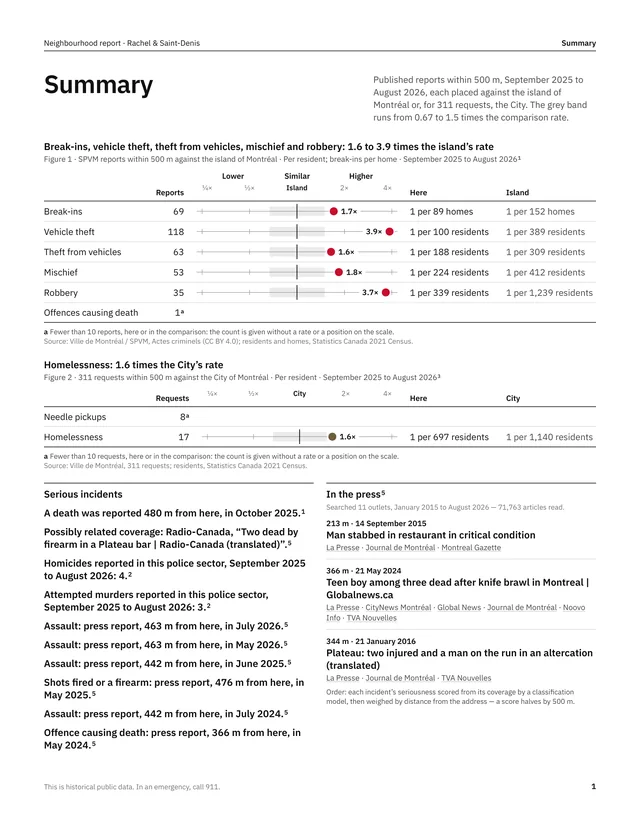
Buying or renting a home, or looking for a business location? The report brings together what public data and press coverage show within 500 m of an address: about 20 pages, in French and English.
About the data
IncidentMTL presents data already published by the City of Montréal. The app distinguishes what each source can — and cannot — show.
View data sources and licencesPolice move every position to a nearby intersection for privacy before publication.
Fire and medical response layers use the exact locations published by the city.
The data is historical and may appear a few days after the fact.
This is historical public data. In an emergency, call 911.
Official City of Montréal open-data portals: SPVM for crime reports, SIM for fire and medical response calls, and Géobase for cross streets.
SPVM moves positions to a nearby intersection before publishing the data, in order to protect privacy.
The datasets are published after the fact. IncidentMTL refreshes them regularly, but never presents them as a real-time feed.
System location is used on your device to centre the map and calculate proximity. It is not continuously tracked. If you save an alert area, the centre you selected is sent to the server so alerts can work.
IncidentMTL for iPhone
Download the app and see the reports published around the places that matter to you.
 Have a question? Email us: bonjour@incidentmtl.com